Trove is the National Library of Australia’s “discovery interface” – an amazing catalogue of books, newspapers, maps, music, journal articles etc. The Trove API is a special website that programs can talk to run queries, retrieve individual records etc. With some creative ideas and a bit of coding skill, you could make a pretty nifty tool and win a digital humanities award.
The documentation is pretty thorough, but doesn’t tell you how to get started. These days, web development is mostly about assembling the right tools and putting them together, but it can be hard for a novice to know what they need.
This guide is for you if:
- You want to try exploring Trove programmatically; and
- You’ve done some coding before; but
- You’re not very familiar with coding against an API, or writing web applications.
In short, if you think the digital humanities might be for you.
What we’ll need
- A server on which to run your web application. You can use your laptop directly, but better to use a virtual machine inside your laptop. Even better, a server running on the internet, like a VM on the NeCTAR Research Cloud.
- A web application framework: Flask and Python
- A library that makes it easy to make requests to other web servers (we’ll use Requests)
- A JavaScript framework which makes dynamically modifying web pages much easier (we’ll use jQuery)
- A CSS framework, which makes your page look attractive with no effort (we’ll use Twitter Bootstrap)
- A templating engine, to combine HTML and the results of our queries into a web page (we’ll use Jinja2)
- Our server logic, expressed as code in files.
A server
As an Australian academic, you can create your own server on the NeCTAR Research Cloud. That would be the best option, but can be a bit fiddly for a novice so we won’t explain that here.
The next best option is to create a server on a virtual machine inside your laptop, using VirtualBox and Vagrant. That keeps everything related to this one project self contained, which is a big bonus when you start working on other projects. It also creates a pristine, controlled Linux environment which means you’re less likely to run into issues cause by the peculiarities of your own system. Try the Vagrant Getting Started guide.
As a last resort, the simplest approach is to just install stuff directly on your computer. This may work ok to begin with.
Building a web application
We’re going to build a web application that will talk to Trove. This isn’t the only approach. You could:
- Build a command line tool that pulls stuff out of Trove and saves it to disk
- Make a desktop application that a user would have to download and install
- Make a static website (not a web application) that does everything with JavaScript.
But a web application is probably what you’re going to want eventually and is the easiest to share with other people.
We’ll use Python, the programming language, and Flask, a web application framework for Python.
Why Flask? It’s easy to install, lightweight, and is well suited to experimental programming like this. (An alternative would be Django, which would be much better if you wanted to store stuff in a database and write something big and scalable.)
You can install these on the command line like this:
sudo apt-get install -y python-pip
sudo pip install flask
That is, first you install Python’s “pip” installer. Pip then knows how to install Python packages like Flask.
Whatever server you’re using, create a directory somewhere (perhaps under your home directory), called ‘trovetest’.
cd ~
mkdir trovetest
cd trovetest
Making requests to the Trove API
The Trove documentation says that to perform a query, we need to access a URL like this:
http://api.trove.nla.gov.au/result?key=<INSERT KEY>&zone=book&q=%22piers%20anthony%22
You might think you need to construct that string yourself, complete with question marks, equals signs and %22’s. You could do that using Python’s built-in urllib2 library:
import urllib2
apikey='1b2c3d4f'
troveURL = 'http://api.trove.nla.gov.au/'
zone = 'book'
search = '%22' + 'piers' + '%20' + 'anthony' + '%22'
r = urllib2.urlopen(troveURL + 'result' + '?' + 'key=' + apikey + '&' + 'zone=' + zone + '&' + 'q=' + search).read()
But it’s easier than that, if we use the Requests library.
import requests
apikey='1b2c3d4f'
troveURL = 'http://api.trove.nla.gov.au/'
searchquery = 'piers'
r = requests.get(troveURL + 'result/', params = {
 'key': apikey,
 'zone': 'book',
 'q': search
 } )
So, install the Requests library as well:
sudo pip install requests
jQuery
These days, virtually all web applications use a JavaScript framework, to make manipulating the web page more practical. We’ll use jQuery, which is also required by Twitter BootStrap.
Create a directory under ‘trovetest’ called ‘static’, and download and unzip the latest jQuery.
CSS Framework
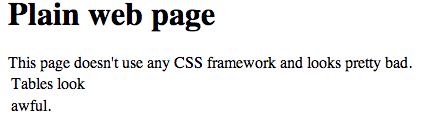
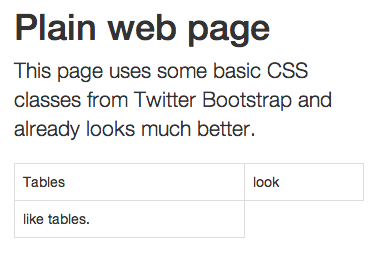
Making a web page look good using straight CSS (cascading style sheets) is really hard. Making it look good in every browser and device is a nightmare. Save yourself the pain, and start from somewhere sensible like Bootstrap, made by Twitter. (By default, it looks a bit like Twitter’s website, but you can change that.)

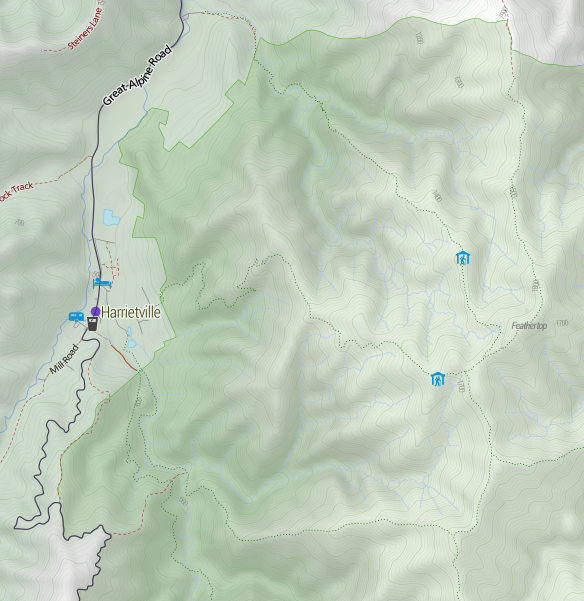
Without Twitter Bootstrap
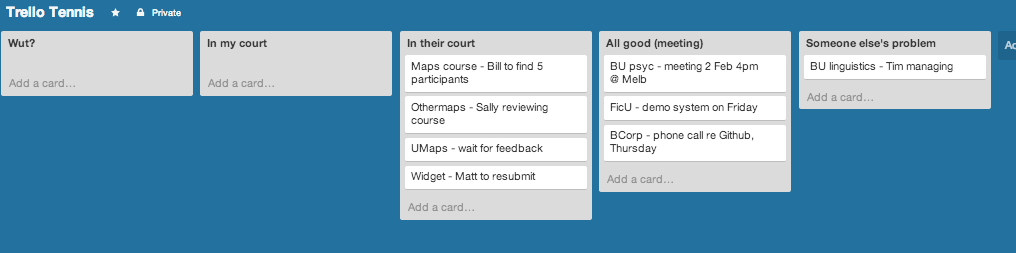
Adding Bootstrap and minimal changes.
Although it’s best to download both jQuery and Boostrap to your server and link to them there, you can get started quickly by linking to them on the web. Just include this text at the top of your HTML files.
<head>
http://code.jquery.com/jquery-1.10.1.min.js
<link rel="stylesheet" href="http://netdna.bootstrapcdn.com/bootstrap/3.1.0/css/bootstrap.min.css">
http://netdna.bootstrapcdn.com/bootstrap/3.1.0/js/bootstrap.min.js
</head>
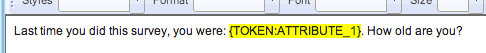
Templating engine
The most common way to build a web page dynamically is by writing a “template” of the HTML page. It can be as simple as this:
<body>
<h1>Request complete</h1>
You requested this article: {{ article.name }}
</body>
When you tell the web application framework to render the page, you pass in the list of variables – in this case, an object called ‘article’ with an attribute ‘name’.

We’ll use the Jinja2 templating engine, because that’s what Flask uses.
Our server logic
Now that everything is in place, let’s write a simple application that will simply make one request. We’ll ask the Trove API for a list of newspaper articles mentioning Piers Anthony (to follow their documentation’s example).
Create this file as ~/trovetest/simple.py
from flask import Flask, render_template, request # load Flask itself
import requests, json # load Requests library, and JSON library for interpreting responses
app = Flask(__name__) # create our web application object, named after this file
apikey = '1b2c3d...' # insert your API key, following instructions here: http://trove.nla.gov.au/general/api
troveURL = 'http://api.trove.nla.gov.au/' # all Trove API URLs start with this

@app.route("/list") # this is what we do when someone goes to "http://localhost:5000/list"
def list(): # the function that defines the behaviour
query = { # this dict structure contains the parameters that make up a URL
'key': apikey, # following the Trove API documentation.
'zone': 'newspaper',
'q': 'piers anthony',
'encoding': 'json', # we specify 'json' as the format because json is easy to parse.
'include': 'tags' }
r = requests.get(troveURL + 'result/', params=query)

# Requests will transform the params property into a string like
# ?key=...&zone=newspaper&q=%22piers%20anthony%22&include=tags&encoding=json

# After calling requests.get(), r is now an object containing lots of information about the response - errors codes, content etc.

r.encoding = 'ISO-8859-1' # We avoid some unicode conversion errors by adding this step.
results=r.json() # Convert the text we receive (in JSON format) into a Python dict
return render_template('list.html', results=results)# Render the template, passing through that dict

app.run(host='0.0.0.0', debug=True) # Run the defined web server, allowing anyone to connect, in debug mode. (This is not safe for a public web server.)
And save this as ~/trovetest/templates/list.html:
<!doctype html>
<head>
    <script src="http://code.jquery.com/jquery-1.10.1.min.js"></script>
    <linkrel="stylesheet"href="http://netdna.bootstrapcdn.com/bootstrap/3.1.0/css/bootstrap.min.css">
    <script src="http://netdna.bootstrapcdn.com/bootstrap/3.1.0/js/bootstrap.min.js"></script>
</head>
<body>
    <title>Trove test</title>
    <h1>Results</h1>

    <ul>
    {% for article in results.response.zone.0.records.article %}
      <li>
        <ahref="{{ article.troveUrl }}">{{ article.title.value }}</a> - <ahref="item/{{ article.id}}">More info</a>
        <br/>
        <i><small>{{ article.snippet | safe}}</small></i>
      </li>
    {% endfor %}
    </ul>
</body>
Run your server
On the command line, tell Python (and hence Flask) to run your application:
/home/ubuntu/trove$ python simple.py
 * Running on http://0.0.0.0:5000/
 * Restarting with reloader
Flask will sit there waiting for someone to connect to your webserver in a browser.
In your browser, go to http://localhost/5000/list
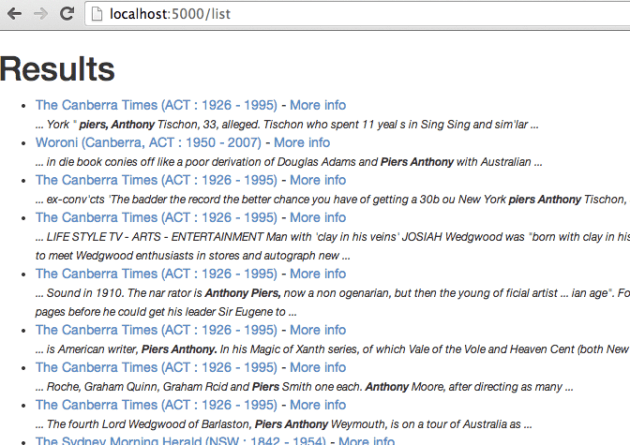
The results of our little Trove query.
What next?
That was a very quick, high level view of all the pieces you need. If you made it through the example, you’re be in an excellent position to start making interesting web applications building on the Trove API. There’s no shortage of information on the web about all these technologies – the hard bit is knowing what you need to know.
All sorts of fun things can be done:
- Cool exploration interfaces
- Bots
- Visualisations like graphs, charts etc
- Text mining and analysis
Tim Sherratt (aka @wragge) has made many fun creations with the Trove API, documented on his discontents.com.au blog. Tim works for the Trove team, who are generally pretty happy to help .


Recent Comments