Steve Bennett blogs

…about maps, open data, Git, and other tech.

Alternative Earth: a procedurally generated map using vector tiles

I make maps. A lot of maps. Almost always of somewhere on Earth. It was time for a change.

The challenge: a procedurally generated map of this alternative Earth, produced on the fly, vector tile by vector tile. An easier approach might be to, say, first generate some continents and coastlines, then erode some mountains with rivers and dot towns in appropriate locations. But I wanted to have a tiny server with no global context. When the user’s browser requests the tile at ZXY coordinates 11/1976/1368, it quickly generates and responds:

Screen Shot 2020-01-03 at 10.00.29 am

So many challenges.

Dynamic vector tile generation

First, we need a server which can generate vector tiles on demand. We use NodeJS Express, with vector-tile specific libraries: vt-geojson, tilebelt, vtpbf.

  1. Find the bounding box (in lat/longs) covering the area for the tile requested.
  2. Generate data that covers that area, in GeoJSON.
  3. Convert the GeoJSON to vector tiles.
  4. Extract the one vector tile requested
  5. Convert it to PBF (Mapbox vector tile format) and send it back.

It’s a bit inefficient to keep generating multiple vector tiles and only selecting one, but it’s simple. :)

It basically looks like this:

Screen Shot 2020-01-03 at 10.10.22 am

I’m using Glitch to host this server: glitch.com/~procmap

Deterministic generation

The big challenge for this kind of procedural generation is to make everything absolutely deterministic, even when it looks “random”. If a formula says the location of a given town is [123.1,-45.7] then it must always be that, no matter which tile the town is generated as part of. The basic strategy goes like this:

  • Use the number-generator library to generate pseudo-random numbers.
  • Before generating any random numbers for a given entity (town, road etc), seed the library with the hash of a string that uniquely identifies that entity.
  • Make a lot of mistakes and get very confused.

Towns on grids

If we were generating the whole world in one go, we could iterate 1,000,000 times, dropping a town in a random location each iteration. Instead, we need to create a global, immutable structure that sort of always “exists” and relate each town to that structure. A simple way to do this (actually, the only one I could think of!) is to use a grid that covers the whole world, where each grid point is one town. That grid point is also the seed for the random number generator, and hence all the town’s properties (name, size etc) derive from its position.

Screen Shot 2020-01-03 at 10.23.33 am


How good this looks in practice comes down to how well we disguise the grid. By simply pseudo-randomly displacing each town up to half a grid coordinate in any direction, it suddenly looks much better:

Screen Shot 2020-01-03 at 10.25.39 am

Actually managing the grid was a bit fiddly. The random displacement means that we don’t know exactly which towns will end up within the vector tile we’re generating for. So we have to generate all towns in or next to the vector tile, then crop the ones that end up falling outside it.

Interesting towns

All the properties are just a question of finding formulas with attractive distributions and representing them appropriately. For instance, the size of a town (on a scale of 1-5) is: Math.ceil(random() * random() * random() * 5).

That is, a cubic distribution so there are far more tiny towns than big ones.

We generate town names with the fake-town-name library, which I wrote for this purpose. It’s pretty simple:

  1. Take a random starting fragment (eg, Ton-, Hyde-, Lang-, Stam-)
  2. Add a random ending fragment (eg -bury, -well, -mont, -rick)
  3. Sometimes add a prefix (eg Outer, North, East, or nothing)
  4. Sometimes add a suffix (eg Creek)
  5. Hence create Outer Tonbury, North Hydewell, East Langmont Creek, or Stamrick.


Roads

The nice thing about roads is that generally they connect two towns, so we have a great place to start from. For each town, look at all the neighbouring towns (the grid makes this very easy!), and consider whether to connect it with a road.

However, there is a trap: our decision for connecting A to B must be the same as that for connecting B to A – and following exactly the same route. So, we use the western-most (northern-most to tie-break) of the two towns as the “A” to seed the random number generator.

The formula I came up with takes a couple of things into account:

  • How near are the towns geographically (closer towns are more likely to connect)
  • How big are the towns (a bigger town has more roads)
  • A general ratio for the number of roads

Screen Shot 2020-01-03 at 10.41.55 am

There’s also a “size” property which is determined by the sizes of the towns at either end: bigger towns cause bigger roads betweens them.

Screen Shot 2020-01-03 at 10.47.47 am

Wiggles

Now, straight roads are boring. We can make a more interesting road by simply adding some extra vertices along the way. We can use a kind of L-system to do this:

  • Between every two vertices, create a midpoint vertex.
  • Randomly displace that vertex by a distance relative to the length of the segment and a “wiggliness” coefficient.
  • Repeat as many times as required (“complexity”).

The wiggliness coefficient is affected by the size of the road (smaller roads between small towns are more wiggly), and the complexity is affected by the zoom level (so we aren’t wasting CPU cycles making very complex roads that can’t even be seen.

Screen Shot 2020-01-03 at 10.48.50 am

Water

Lakes and coastline are quite challenging. If we simply randomly decide that a given area is water or land, we will probably end up with an unattractive pattern of many fragmented lakes.

We start with the same grid structure as towns, but on a bigger scale. Next, we use Simplex Noise as a method for determining whether there is water somewhere. It naturally produces big clumps that work well for this purpose.

Screen Shot 2020-01-03 at 10.59.05 am.png

Perfect. Let’s distort this grid, too.

Screen Shot 2020-01-03 at 12.32.51 pm.png

The one thing missing is interesting coastlines/lake edges. Let’s start by extending each straight edge into a triangle, with the tip a random location somewhere in the neighbouring cell.

Screen Shot 2020-01-03 at 11.06.19 am.png

Then we can apply the same complexification algorithm that we used for roads.

Screen Shot 2020-01-03 at 11.07.11 am

Finally,Ā  by using slightly different parameters to these algorithms we can generate “deep water” and “beach” layers.

Screen Shot 2020-01-03 at 11.07.36 am.png

Forests are water

Forests are literally created using the same process as water, but slightly different parameters.

Screen Shot 2020-01-03 at 11.10.01 am copy

Limitations

One obvious limitation in this approach is that the layers we generate don’t interact with each other. We’re just slapping a lake over the top of the map and hoping no one notices that there are towns under there. Labels get cut off, highways mysterously disappear into the water.

Another problem is that it’s tricky to make things that require more than local context. We’d like major highways to purposefully connect distant cities, passing through small towns on the way. Not just starting and stopping at random. We’d like railways that similarly have an overall direction, and don’t meander too much. Most of all, we’d like streams that flow in one direction, continually merging with other streams to become rivers, eventually emptying into lakes and seas. I’m not sure how to achieve that.

There is also a reversability problem. We can generate a random location for a town from grid position, but it would be good to be able to find the grid position from the generated location. It would be nice to be able to search for a town name without brute force.

Finally, there are challenges with the vector tiling process. For instance, by restricting our search for roads to towns within the current tile, we miss out on roads that merely cross the tile without originating or ending within it. For instance, here the town from Katefields to Ilwick doesn’t show up in the bottom left tile, and the road from Morganburn northeast is not shown in the bottom right tile. We can reduce the visibility of this issue by using bigger vector tiles, but probably we just need to search a bit wider for towns.

Screen Shot 2020-01-03 at 12.37.48 pm

All up, I’m pretty happy with the result. It’s been a lot of fun so far. :)

Have a play at stevage.github.io/alt-world!

Screen Shot 2020-01-03 at 11.14.27 am


Host your own vector tile server on Glitch

Most of the time, when you need to host vector tiles, you’ll use one of the two main (only?) commercial vector tile hosting services: Mapbox or Maptiler Cloud. But what if you don’t want to? Maybe you want to host tiles which don’t meet Mapbox’s 500KB-per-tile limit. Maybe you have some very specific requirement which can’t be met by those services.

We’ll use Glitch: your free NodeJS server edited through a web interface.

And Tessera: a NodeJS vector tile server. You tell it where your .mbtiles files are, and it serves them through an HTTP interface.

1. Create a project

We actually won’t use any of the provided template at all. You can start with the hello-express template.

Screen Shot 2019-12-18 at 11.23.50 am

2. Install Tessera

The easiest way to add dependencies is to select “package.json” then click “Add Package”.

  1. Add “tessera”.
  2. Add “mbtiles”. (By default Tessera doesn’t actually support mbtiles files. It’s a bit weird.)

Actually, because of a weird disagreement between Tessera and Glitch about the interpretation of a non-standard obscure HTTP header, you’ll have to use my patched version instead. Add this dependency directly into the package.json:

“tessera”: “stevage/tessera.git#x-forwarded-proto”

Now, we need to tell Glitch to run Tessera instead of the templated code that was set up for us. Change the “scripts” section to look like this:

Screen Shot 2019-12-18 at 10.05.29 am

3. Upload your .mbtiles file

Under “New File”, select “Upload a file”. Pick an .mbtiles file you have, upload and wait.

Screen Shot 2019-12-18 at 9.52.49 am

4. Really upload your .mbtiles file

Now, here’s the one tricky, rather clunky step. The asset you uploaded will actually live on Glitch’s assets CDN. It needs to be inside your server, so that Tessera can access it.

Inside the Glitch console (under “Tools”), first find out where the mbtiles file is, by running “less .glitch-assets”.

Look for a line like:

{“name”:”lgas.mbtiles”,”date”:”2019-12-17T22:56:15.660Z”,”url”:”https://cdn.glitch.com/982234c74-247f-4e51-9416-944436678291%2Flgas.mbtiles”

Extract out that url, and download it, choosing a sensible name:

$ wget -O lgas.mbtiles “https://cdn.glitch.com/982234c74-247f-4e51-9416-944436678291%2Flgas.mbtiles”

5. Configure Tessera

Now we’re going to make the config.json file promised in our package.json. In the main editor, create a new file, config.json.

My tiles contain local government areas (lgas), so this is what my config.json looks like:

Screen Shot 2019-12-18 at 10.12.18 am

Make sure the URL there points to the location of your specific file. It must start with “mbtiles://./”.

6. Test

Under “Show”, choose “Next to the Code” so we can whether Tessera is running correctly.

Click “Change URL” to access the TileJSON for your tile layer. In my case that looks like:

Screen Shot 2019-12-18 at 10.15.29 am

Check the JSON carefully. If you see ”

"filesize":0

or

"format":"png"

it means that Tessera couldn’t find your .mbtiles file, and created a blank one, assuming the file format was .png. (Yes, these are some interesting choices.)

7. Use your tiles!

You can now use your tiles in any Mapbox-GL-JS project. Instead of an identifier like “mapbox://stevage.nt2h43nh”, you’ll have a URL like “https://demo-tessera.glitch.me/lgas/index.json”. (You can use either HTTP or HTTPS – Glitch and Tessera support both.)

For instance, using mapbox-gl-utils:

Screen Shot 2019-12-18 at 11.21.35 am

Screen Shot 2019-12-18 at 11.17.08 am

Building TinyMap: an itty bitty collaborative mapping tool

At FOSS4G Oceania 2019, I lamented the lack of free tools for collaboratively maintaining small datasets of locations, a common need in many community groups. So, this weekend I had a go at building one: TinyMap! A simple tool that lets you add and remove points with names and descriptions from any map you care to name.

Design goals:

  • Zero-cost to host.
  • Shave every possible corner on implementation effort (security, scalability, performance…)
  • Get it done in a weekend.

Learning authentication seemed more like work than fun, so I’ve decided to rely on secret URLs as the only security mechanism. The burden of choosing an unguessable URL, and not distributing it, lies entirely on the users. I’m sure this will end well.

Screen Shot 2019-12-15 at 9.18.39 pm.png

Back end

For storing and retrieving a few hundred points, running PostGIS seems overkill. Even using a hosted NoSQL solution like FireBase felt much too serious. I really wanted the NoSQL equivalent of SQLite, and eventually found TingoDB, which is basically MongoDB but in pure NodeJS.

Screen Shot 2019-12-15 at 9.22.41 pm

Writing an API wrapper around it with Express is pretty easy. I don’t write many servers, but the Express documentation is always such a pleasure to use. Just under 100 lines of code to provide CRUD services and very basic authentication.

Screen Shot 2019-12-15 at 9.24.55 pm

And where to host? On my favourite free NodeJS hosting platform, Glitch. It can sometimes feel a bit weird writing code directly in the browser, but it’s really nice skipping directly over the questions of “where should I host this?”, “how do I get my code there?” and “how do I make the server accessible to the outside world?”. Glitch makes for insane levels of productivity: just clone the Express starter project, and go ā€“ it’s already running.

Screen Shot 2019-12-15 at 9.28.27 pm

We end up with an API structure like:

You can see the code here: https://glitch.com/edit/#!/shared-map-api

Front end

The front end builds on my “community-map” VueJS template which provides a basic app structure, with the Tachyons CSS kit, and initialises a Mapbox-GL-JS map enhanced with my mapbox-gl-utils library and primed to deploy to Github Pages. I wanted to keep it as simple as possible.

Three URL structures are understood:

  • /?layer=layername&secretkey=mysecret: user can add and delete features on the “layername” layer.
  • /?layer=layername: user can view features on the layername layer
  • /: user is invited to create a new map.

Interaction code can be surprisingly verbose to write. The simple mechanic of “click add, click the map, type a name and description, click save” immediately spawns questions such as “what if the user wants to cancel?” and “what if the user clicks on an existing point while they’re meant to be adding a new one?”

Screen Shot 2019-12-15 at 9.51.07 pm

For simplicity, I’ve been trying to avoid storing any information about the map itself – only the points themselves are stored. That means, there’s no way to define where you want the viewpoint to be centred. My sneaky solution to that is to always centre it around where the points are.

Screen Shot 2019-12-15 at 9.46.25 pm

There is absolutely no error handling. If you enter an incorrect secret key, there is no warning – mostly because I didn’t have a method offhand for flashing an alert.

There is also no way to edit an existing item (yet).Ā  Or to add any fields other than Name and Description. (Now it’s possible to existing items :) )

Front-end hosting is easy to set up on Github Pages. I like to put a domain name on even weekend hack projects, so, inspired by too many episodes of TinyHouse Nation, I went with tinymap.website.

The front-end code is on Github: https://github.com/stevage/tinymap/

Conclusion

Cutting corners is so liberating. If you’re not actually building the next great SaaS, perhaps you don’t need a high performance database. Maybe you don’t need Kubernetes, and a tiny service running on Glitch will do.

I’m not sure what happens next with TinyMap. If you like it, let me know!

You might not need PostGIS: streamlined vector tile processing for big map visualisations

I recently re-engineered the data processing behind OpenTrees.org. It’s a website that lets you explore the combined open tree databases of 21 local councils around Australia (over 800,000!), with some pretty data visualisations. Working on this site has taught me a lot about processing data into vector tiles. Today’s lesson: “You might not need PostGIS”.

Screenshot 2018-05-15 11.19.19.png

Trees from Melbourne, Hobson’s Bay and Brimbank.

First version: Tilemill, PostGIS, PGRestAPI

The architecture of v1 looked like this: (See “OpenTrees.org: how to aggregate 373,000 trees from 9 open data sources“).

  • Configuration file in JSON stores the location of each source file.
  • Bash scripts using JQ (yes, really) to run wget, ogr2ogr and psql to fetch, convert and load each datafile into PostGIS.
  • SQL scripts to merge and clean the datasets together into a single schema.
  • Tilemill to generate raster tiles from the data.
  • PGRestAPI to provide a queryable interface to the data (particularly to allow the map to zoom to a particular tree by ID).
  • Nginx serving the front end, built with Mapbox.js (a wrapper around Leaflet).
  • The magic of UTFGrid allows interrogating individual tree points. (I still love this technology.)

It worked fairly well, but with the huge disadvantage of having to host a web-accessible server, complete with database.

Second version: Mapbox-GL-JS, vector tiles, static hosting

When I lost access to my free hosting, I re-architected it using Mapbox-GL-JS: v2.

  • Same scripts to fetch and process data into PostGIS.
  • More scripts which export data out of PostGIS and call Tippecanoe to generate vector tiles, which I then upload to Mapbox.com.
  • No Tilemill
  • Brand new front-end built using Mapbox-GL-JS, with some clever new data visualisation, such as visualising by “rarity”.
  • No PGRestAPI. Clicking on a tree updates the URL to include its lat/long, so you have a shareable link that will go to that tree.
  • Front end hosted on Github Pages.

Now we don’t need a server (Github Pages and Mapbox are serving everything we need, and are free). But we still have the heavy dependency of PostGIS.

Do we really need PostGIS?

What is PostGIS actually doing in this scenario? Mostly it’s doing very simple row-oriented, non-relational operations like:

Screenshot 2018-05-15 10.35.52.png

or:

Screenshot 2018-05-15 10.36.24.png

(Yes, I should have used SPLIT_PART())

And then finally we just dump the whole table out to disk.

I began trying to replace it with Spatialite, but that didn’t seem to play very nicely with NodeJS for me. As soon as it got fiddly, the benefits of using it over Postgres began to disappear.

And why did I even need it? Mostly because I already had scripts in SQL and just didn’t want to rewrite them.

So, the disadvantages of PostGIS here:

  • It’s a big, heavy dependency which discourages any other contributors.
  • The data processing scripts have to be in SQL, which introduces a second language (alongside Javascript).
  • No easy way to generate newline-delimited GeoJSON (which would make generating vector tiles a bit faster.)

Third version: NodeJS, Mapbox

So, I rewrote it as v3:

  • Replaced the Bash scripts with NodeJS. Which means, instead of the nonsense of JQ, we have sensible looking Javascript for which the JSON config files work well.
  • Instead of loading Shapefiles into PostGIS, I convert everything into GeoJSON.
  • Instead of SQL “merge” scripts, a NodeJS script processes each tree then writes them all out as a single, line-delimited GeoJSON file.
  • Tippecanoe then operates on that file to generate vector tiles, which I upload to Mapbox.
  • Split the repository in two: one for the data processing (“opentrees-data“), and a separate one for the front end (“opentrees“). This seems to be a good pattern.

The workflow now looks like:

  1. 1-gettrees.js uses a configuration file to fetch datasets from predefined locations and save them, in whatever formats, in a standard place.
  2. 2-loadtrees.js converts each of these files into a geojson file using OGR2OGR.
  3. 3-processFiles.js loads each of these, processing all the individual trees into a standard schema, then writes out a single combined line-delimited GeoJSON.
  4. 4-vectorTiles.sh uses Tippecanoe to generate an mbtiles from the GeoJSON.

The processing scripts now look like:

Screenshot 2018-05-15 10.06.04.png

Screenshot 2018-05-15 10.07.11

For now, each GeoJSON file is loaded entirely in one synchronous load operation.

Screenshot 2018-05-15 10.41.32

(Processing all the GeoJSONs this way takes about 55 seconds on my machine. Loading them asynchronously reduces that to about 45. Most of the time is probably in the regular expressions.)

The only slight hurdle is generating the species count table. With PostGIS, this is just one more query run after all the others:

Screenshot 2018-05-15 10.23.15.png

In NodeJS, our “process each tree once” workflow can’t support this. After processing them once (counting species as we go), we process them all again to attach the species count attribute.

Screenshot 2018-05-15 10.19.27

If we were doing a lot of statistics, possibly PostGIS would start to look attractive again.

Do we really need OGR2OGR?

The next dependency I would like to remove is OGR2OGR. It is there because datasets arrive in formats I can’t control (primarily CSV, Shapefile, GeoJSON). I love using Mike Bostock’s shapefile library, but it doesn’t currently support projections other than EPSG:4326. That’s not a showstopper, just more work.

It would also be great not to have to maintain VRT files (in XML!) to describe the CSV formats in which data arrives.


OpenStreetMap vector tiles: mixing and matching engines, schemas and styles

For my next web mapping project, we’ll use vector tiles. Great. And the data will come from OpenStreetMap. Excellent. Now you only have five more questions to answer.

For the front-end web application developer who wants to stick a map in their site, vector tiles open up lots of options and flexibility, but also lots of choices.

  • Display engine: which JavaScript library is going to actually draw stuff in the browser?
  • Style: how will you tell the display engine what colour to draw each thing in the schema?
  • Data schema: what kinds of data are contained in the tiles, what are the layers called, and what are the attributes available?
  • Tile transport: how will the engine know where to get each tile from?
  • File format: how is the data translated into bytes to store within a tile file?

We’re very lucky that in a couple of these areas, a single standard dominates:

Which leaves three decisions to make.

Display engine

There are several viable options for displaying your vector tiles, depending on whether you also want to display raster tiles or need creative styling, if WebGL (IE11+ only) is ok, and what else you need to integrate with.

Screenshot 2017-08-22 23.26.11.png

Mapbox Terrain, a style rendered with Mapbox-GL-JS.

  • Mapbox-GL-JS: the industry leader, made by Mapbox, uses webGL, focused on the needs of mass-market maps for large web companies. It has excellent documentation, great examples and very active development.
  • Tangram: made by Mapzen, also uses WebGL, has more experimental and creative features like custom shaders.
  • OpenLayers: a fully-featured, truly open source mapping library primarily built for raster tiles, but with vector tile support. (Disclaimer: I’ve never used OpenLayers, I’m just reading docs here.)

There are other combinations as well, such as Leaflet.VectorGrid.

Style

The style mechanism tends to be closely tied to the display engine. (That was also true of CartoCSS, which was a pre-processor for Mapnik. RIP).

  • Mapbox Style Specification is a single JSON file which defines sources (vector tiles, GeoJSON files, raster tiles etc) and their display as layers (circles, fills, lines, text, icons etc), including properties that depend on zoom and/or data values. It also has some fiddly details for displaying custom fonts and symbols. Supported by Mapbox-GL-JS and Mapbox.js, but no third-party front-end libraries that I’m aware of. (Geoserver, a Java-based web application seems to have support.) Styles can be created with Mapbox Studio, Maputnik (free, open source) or by hand.
  • OpenLayers style is a JSON object for OpenLayers. It doesn’t seem to exist as a file format per se. (I’m not sure why the demo above just uses a ton of JavaScript statements rather than this style object.)
  • Tangram scene file, a YAML format which covers a bit more than just styling data, such as cameras and lighting.

Schema

Finally, there are three distinct, well-defined schemas for packaging OpenStreetMap data into vector tiles. There doesn’t seem to be a formal specification for how you define a schema, so each is presented as documentation: a list of layers, each with a list of attributes (and their possible values), and at which zoom levels they appear.

  • Mapbox Streets v7Ā (22 layers): a highly processed version of OpenStreetMap data optimised for simplicity and performance, geared towards general mapping applications. Layer and attribute names often reflect original OSM tag names (“waterway, class=stream”) but not slavishly (“road, class=link”, “road,
    Dark Matter (OpenMapTiles)

    Dark Matter, a Mapbox Style for OpenMapTiles.

    class=major_rail”).

  • OpenMapTilesĀ (15 layers): an open schema developed by Klokan (a Swiss company) “in cooperation with the Wikimedia foundation”. It is a bit looser with layer names (“transportation, class=minor”) and occasionally quirky (“transportation, brunnel=tunnel”)
  • MapzenĀ (9 layers): includes both simplified “kind=” and original OSM “kind_detail=” tags on almost every object, Ā making them heavier than the alternatives. Somewhat confusingly, all waterway/water features are combined into a single layer and distinguished only by geometry (line or polygon). At lower zooms, data is sourced from Natural Earth, instead of OSM ā€“ I don’t know why. (A lot of work goes into these decisions!)

Matching schemas and styles

Now, the style needs to be designed for theĀ schema: if the schema contains a layer called “roads”, your style can’t be expecting a layer called “transportation”. But it also needs to be expressed in the right format supported by theĀ engine: don’t go feeding no YAML to Mapbox-GL-JS.

For instance:

  • Mapbox BasicĀ uses the Mapbox Streets schema, and is expressed in the Mapbox
    Tron.png

    Tron, a highly stylised style from Mapzen for Tangram.

    Style Specification. And hence can be rendered by Mapbox-GL-JS, or OpenLayers. (Other standard Mapbox styles include Mapbox Streets, Mapbox Terrain and Mapbox Dark)

  • Cinnabar uses the Mapzen schema, and is expressed as a Tangram scene file. (Other Mapzen styles include Bubble Wrap, Tron, Zinc, Walkabout and Refill).
  • Klokantech Basic uses the OpenMapTiles schema, and is expressed in Mapbox-GL-JS. (Other OpenMapTiles styles include Positron, Dark Matter, OSM Bright, Toner and Fjord Color).

These styles kind of live within their company affiliations, however. How about styles rendered by one company’s engine, using data from a different schema:

  • Tilezen uses Mapzen’s schema, but is rendered with Mapbox-GL-JS. Demo. (There are also Mapzen examples for OpenLayers and D3). This token effort by Mapbox achieves the same thing.
  • This example uses OpenMapTiles, rendered using Tangram.

Mixing and matching

Which brings us to the point of this post. How do youĀ mix schemas and styles? That is, how do you take a style you designed for Mapbox Streets, and make it work on OpenMapTiles? Or port one of Mapzen’s kooky open-licensed styles so it works with Mapbox Streets? Well, you can’t – yet.

(Adapting a style from one engine to another, like whatĀ ol-mapbox-styleĀ does, is a tough ask, because engines’ capabilities differ.)

But adapting a Mapbox Style file from one OpenStreetMap schema to another? That seems totally doable – even if there isn’t yet a tool to make that happen.

My quick little proof of concept in NodeJS converted OpenMapTiles’ “OSM Bright” style (left) to versions for Mapbox Streets (centre) and Mapzen (right).

Screenshot 2017-08-17 21.52.54

Want to give me a hand? Get in touch!


2015’s proudest moments

Self-doubt is awful, so this is for Future Steve: here are lots of things you did in 2015 that you can be proud of!

  1. CreatedĀ opentransportdata.org: Swagger API documentation for PTV’s real-time API, as part of the VicTripathon hackfest. PTV’s documentation is a developer’s nightmare. My version has live testing of the API built in and links to various wrappers in different languages.
  2. Designed a process for judging mobile apps (way outside my area of expertise!) for VicTripathon, across 4 different platforms, with help from Installr. Measure of success: the devs said it was ok.
  3. Created opentrees.org: a fun way to explore the combined tree inventories of a dozen councils across Australia.
  4. Created openbinmap.org: uses open data published by councils in standard formats to tell you if it’s bin night where you live. Provides a nice incentive for councils publishing their first datasets.
  5. Created standards.opencouncildata.org: lightweight, open standards so that councils publishing the same data can do so in an interoperable way. And some of them are actually using it!
  6. opencouncildata.org: The OpenCouncilData toolkit (co-created with Ellen Bicknell), provides a lot of guidance and useful background for councils embarking on the open data journey.
  7. map.opencouncildata.org: A constantly updated map showing exactly how many datasets each council is currently publishing.
  8. csv-geo-au: A standard for publishing spatial data that refers to regions such as ABS statistical divisions or Australian commonwealth electoral divisions.
  9. Helping get VicRoads and Geelong’s street-level imagery on Mapillary.
  10. Building an automatic feed of real-time environmental data into City of Melbourne’s open data portal.
  11. AusTrails.org: A proof of concept for a super trail finder, which won a GovHack prize with help from Matt Cengia.
  12. Built 5 Terria-based maps: NEII Viewer (BOM), City of Sydney Environment and Sustainability Portal, a proof of concept for the Greater Sydney Commission, Northern Australia Investment Map, and ParlMap. The last is not public, but a really nice clone of NationalMap providing access to historical election and electoral boundary data for parliamentarians and the Parliamentary Library staff.
  13. Helped organise HealthHack: weĀ had 10/10 happy problem owners in Melbourne, 60 participants, and a really awesome atmosphere.
  14. Wrote the definitive guide to YAML multi-line strings. (Ok, I started it last year, but most of the grunt work was this year).
  15. Participated in developing the next version of Fiscal Data Package, including a major change in presentation.
  16. Got a photo I took on the front cover of a book,Ā Exploring the Jagungal Wilderness. (It’s also a physical book).
  17. Spoke about open data and National Map at lots of events: Local Government Spatial Reference Group, data.gov.au forum, MAV Technology forum (local government), Ā WebNetwork (local government), NewTech (state government), Open Data Government Community Forum (federal)
  18. Organised a Spatial Analytics for Policy Makers WorkshopĀ in the Victorian Government, with speakers from four different mapping platforms represented.
  19. Taught mapping workshops at La Trobe and Victoria University.
  20. Refactored and seriously improved part of the TerriaJS code that that deals with region mapping CSV files, plus much better choroplething.
  21. Designed and launched the GeoNext hackfest.
  22. Co-organised 5 cycle tours: Moe-Inverloch-Port Albert-Rosedale, Nelson-Warrnambool, Geelong-Rye-Melbourne, Tallarook-Jamieson-Benalla, Mt Beauty-Hotham-Falls Creek-Wangaratta.

Your own personal National Map with TerriaJS: no coding and nothing to deploy

National Map is a pretty awesome place to find geospatial open data from all levels of Australian government. Ā (Disclaimer: I work on it at NICTA). But thanks to some not-so-obvious features in TerriaJS, the software that drives it, you can actually create and share your own private version with your own map layers ā€“ without programming, and without deploying any code.

What you get:

  • A 3D, rotateable, zoomable globe, thanks the awesome Cesium library. (It seamlessly falls back to Leaflet if 3D isn’t available.)
  • Selectable layers, grouped into an organised hierarchy of your devising
  • Support for a wide range of spatial services: WMS, WFS, ESRI (both catalogs and individual layers for all of these), CKAN, individual files like GeoJSON and KML, and even CSV files representing regions like LGAs, Postcodes, States…
  • Choose your own basemap, initial camera position, styling for some spatial types, etc.

1. Make your own content with online tools

Want to create your own spatial layer – polygons, lines and points? Use geojson.io and choose Save > Gist to save the result to Github Gist.Ā (Gist is just a convenient service that stores text on the web for free).

Screenshot 2015-07-02 07.56.52

How about a layer of data about suburbs by postcode? Create a Google Sheet that follows the csv-au-geo specification (it’s easy!), download as CSV, paste it into a freshĀ Gist.

Screenshot 2015-07-02 08.02.28

2. Create a catalog with the Data Source Editor

Using the new TerriaJS Data Source Editor (I made this!), create your new catalog. You’re basically writing a JSON file but using a web form (thanks json-editor!) to do it.

To add one of your datasources on Gist, make sure you link to the Raw view of the page:

Screenshot 2015-07-02 08.07.02

Screenshot 2015-07-02 08.08.16

Don’t forget to select the type for each file: GeoJSON, CSV, etc.

3. Add more data

You might want to bring in some other data sources that you found on National Map. This can be a little tricky – there’s a lot of complexity in accessing data sources that National Map hides for you.

But here’s roughly how to go about it for a WMS (web map service) data source.

In the layer’s info window, grab the WMS URL

Screenshot 2015-07-02 10.53.13

You’ll need to put “http://nationalmap.gov.au/proxy/” in front of a someĀ layers, because their WMS servers don’t support CORS.

You’ll also need the value of the “Layer name” field. (For Esri layers you need to dig a bit further.)

Screenshot 2015-11-13 11.10.55

(Yes, this layer is called “2”)

Add a WMS layer, and add “Layers Names” as an additional property. So it looks like this:

Screenshot 2015-07-02 10.55.54

4. Tweak your presentation

You can add extra properties to layers to fine tune their appearance. For example, for our CSV dataset:

Screenshot 2015-07-02 10.57.49

You might want to set “Is Enabled” and “Is Shown” on every layer so they display automatically.

And finally, you might want to set an initial camera and base map, so the view doesn’t start off the west coast of Africa with a satellite view.

Screenshot 2015-07-02 10.39.55

5. Save and preview

Screenshot 2015-07-02 10.46.41

As you make changes, click “Save to Gist” to save your configuration file to a secret location on Gist. You can then click “Preview your changes in National Map”.

Screenshot 2015-07-02 11.01.19

Make a note of the Gist link so you can keep working on it in the future. You can’t modify an existing configuration, but you can load from there and save a new copy.

6. Share!

Now you have a long URL like this:Ā http://nationalmap.research.nicta.com/#clean&https%3A%2F%2Fgist.githubusercontent.com%2Fanonymous%2Fc3f181ca742b9ed94fe4%2Fraw%2F10853f7d8bb33610e4f2ce26947eaf6882192957%2Fdatasource.json

So, useĀ tinyurl.com or another URL shortening service to get something more useful:

http://tinyurl.com/myawsummap

After the hackathon: 4 classic recipes

CC BY-ND 2.0, NAIT.

Everyone loves hackathons. And almost as much, everyone loves asking “but what happens to the projects afterwards?” There’s more than one route to follow. I’d like to propose four standard recipes we can use to describe the prospects of each project.

#1: Start-up

The creators of the hack could form a business. The developers work very hard to polish up what they’ve written until it’s a viable product ready for the marketplace, and then try to build a start-upĀ around it while probably looking for external funding.

Snap Send Solve - hackathon to start-up success story

Snap Send Solve – hackathon to start-up success story

This kind of resultĀ is very desirable for hackathon organisers because there is such a clear story of benefits and outcomes: “a few thousand dollars of sponsorship paid for a weekend hackathon which led to this $50 million start-up which makes the app your grandma uses, which is great for the economy”.

Ingredients required: Start-up mentors, entrepreneurs, a business focus from the get-go

#2: Government app

OpenBinMap.org - a government app in waiting?

OpenBinMap.org – a government app in waiting?

If you make an interesting and useful app with a government body’s data, then maybe they’d like to take it on board. They might use the code base, but it’s probably better to use the concept and vision and write the code from scratch. Imagination isn’t a government strong suit, but once they see something they like, they’re pretty good at saying “we need one of those”.

This also doesn’t seem to happen very often, but can we try harder?Ā We should follow GovHackĀ up with serious discussions between hack developers and the government bodies that sponsored them. Following my cheeky “CanIBoatHere.com” category winner last year, I did meet with Transport Safety Victoria, but didn’t really have the time or motivation to pursue it. But they were very keen, so why couldn’t we have made it work? Similarly, there was potentially money available from the Victorian Technology Innovation Fund to support GovHack projects, but no clear process meant that months of fumbling through paperwork might eventually lead to nothing. Not so appealing to developers.

IngredientsĀ needed: A solid process, government/developer wranglers, pre-commitment to funding.

#3: Community project

Eventable would make a great community project.

Eventable would make a great community project.

If a hackĀ is interesting and important enough to other developers, could itĀ become a self-sustaining open source project? The idea seems plausible, but I don’t know if I’ve seen it happen. The major blockers are the hackish quality of the code itself which typically would require a major rewrite, and the sense that the weekend was fun, and this would be a lot of work. HacksĀ are a kind of showy facade. Once developers sit down to talk seriously about onward development, all kinds of serious difficulties start to emerge. And between the end of the weekend and the announcement of prizes a lot of momentum gets lost which can be hard to start up again.

IngredientsĀ needed:Ā Post-hackathonĀ events to explore projects and establish communities.

#4: Story

Living, Breathing Melbourne - still just a story.

Living, Breathing Melbourne – still just a story.

And finally, let’s acknowledge that the most important part of many hacks is their potential as an interesting story in their own right. Anthony Mockler’s GovHack 2012 entry “Is your Pollie Smarter than a Fith Grader” isn’t a failure because it didn’t lead to a start up – it was a great story that captured a lot of attention. My team’s 2014 entry “Living, Breathing Melbourne” has been frequently referred to as a model for actual open data dashboards, even though we didn’t develop it further. We should try to extract as much value as possible from these stories, and preserve their essence, even if only in screenshots and blog posts.

Ingredients needed: Story tellers, blog posts, active engagement with journalists

In summary

Let’s think of these different paths early on when discussing projects: “This would make a great community project“, “I don’t see this going anywhere, but let’s get the story out”, “It would be a shame if the department doesn’t take this on as a government app“. And don’t write off a hack just because it didn’t fit into the mould you were thinking of.

OpenTrees.org: how to aggregate 373,000 trees from 9 open data sources

I try to convince government bodies, especially local councils, to publish moreĀ open data. It’sĀ much easier when there is a concrete benefitĀ to point to: if you publish your tree inventory, it could be joined up with all the other councils’ tree inventories, to make some kind of big tree-explorey interface thing.
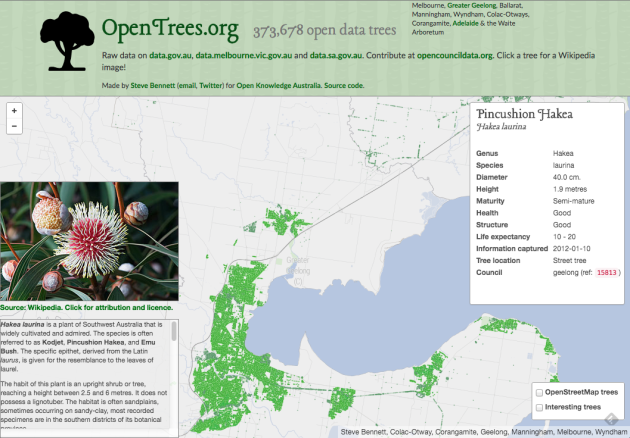
Introducing:Ā opentrees.org. It’s fun! Click on “interesting trees”, hover over a few, and click on the ones that take your fancy. You can play for ages.

Here’s how I made it.

First you get the data

Through a bit of searching on data.gov.au, I found tree inventories (normally called “Geelong street trees” or similar) for:Ā Geelong, BallaratĀ (both participating in OpenCouncilData), Corangamite (I visited last year), Colac-Otways (friends of Corangamite), Wyndham (a surprise!), Manningham (total surprise). It showed two results from data.sa.gov.au:Ā Adelaide, and the Waite Arboretum (in Adelaide). Plus the City of Melbourne’s (open data pioneers) “Urban Forest” dataset on data.melbourne.vic.gov.au.

Every dataset is different. For instance:

  • GeoJSON’s for Corangamite, Colac-Otways, Ballarat, Manningham
  • CSV for Melbourne and Adelaide. Socrata has a “JSON” export, but it’s not GeoJSON.
  • Wyndham has a GeoJSON, but for some reason the data is represented as “MultiPoint”, rather than “Point”, which GDAL couldn’t handle. They also have a CSV, which are also very weird, with an embedded WKT geometry (also MULTIPOINT), in a projected (probably UTM) format. There are also several blank columns.
  • Waite Arboretum’s data is in zipped Shapefile and KML. KML is the worst, because it seems to have attributes encoded as HTML, so I used the Shapefile.

Source code for gettrees.sh.

Tip for data providersĀ #1: Choose CSV files for all point data, with columns “lat” and “lon”.Ā (They’re much easier to manipulate than other formats, it’s easy to strip fields you don’t need, and they’re useful for doing non-spatial things with.)

Then you load the data

Next we load all the data files, as they are, into separate tables in PostGIS. GDAL is the magic tool here. Its conversion tool, ogr2ogr, has a slightly weird command line but works very well. A few tips:

  • Set the target table geometry type to be “GEOMETRY”, rather than letting it choose a more specific type like POINT or MULTIPOINT. This makes it easier to combine layers later.
    -nlt GEOMETRY
  • Re-project all geometry to Web Mercator (EPSG:3857) when you load. Save yourself pain.
    -t_srs EPSG:3857
  • Load data faster by using Postgres “copy” mode:
    –config PG_USE_COPY YES
  • Specify your own table name:
    -nln adelaide

Tip for data providers #2: Provide all data in unprojected (latitude/longitude) coordinates by preference, or Web Mercator (EPSG:3857).

CSV files unfortunately require creating a companion ‘.vrt’ file for non-trivial cases (eg, weird projections, weird column names). For example:
<OGRVRTDataSource>
<OGRVRTLayer name="melbourne">
<SrcDataSource>melbourne.csv</SrcDataSource>
<GeometryType>wkbPoint</GeometryType>
<LayerSRS>WGS84</LayerSRS>
<GeometryField encoding="PointFromColumns" x="Longitude" y="Latitude"/>
</OGRVRTLayer>
</OGRVRTDataSource>

The command to load a dataset looks like:
ogr2ogr --config PG_USE_COPY YES -overwrite -f "PostgreSQL" PG:"dbname=trees" -t_srs EPSG:3857 melbourne.vrt -nln melbourneĀ -lco GEOMETRY_NAME=the_geom -lco FID=gid -nlt GEOMETRY
Source code for loadtrees-db.sh.

Merge the data

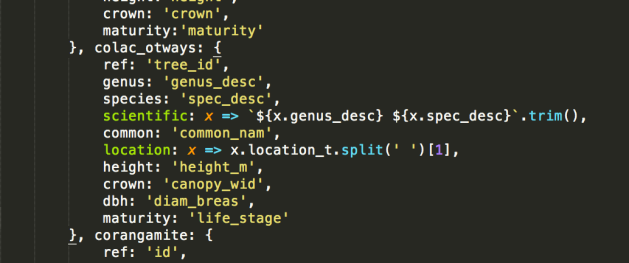
Unfortunately most councils do not yet publish data in the (very easy to follow!) opencouncildata.org standards. So we have to investigate the data and try to match the fields into the scheme. Basically, it’s a bunch of hand-crafted SQL INSERT statements like:
INSERT INTO alltrees (the_geom, ref, genus, species, scientific, common, location, height, crown, dbh, planted, maturity, source)
SELECT the_geom,
tree_id AS ref,
genus_desc AS genus,
spec_desc AS species,
trim(concat(genus_desc, ' ', spec_desc)) AS scientific,
common_nam AS common,
split_part(location_t, ' ', 1) AS location,
height_m AS height,
canopy_wid AS crown,
diam_breas AS dbh,
CASE WHEN length(year_plant::varchar) = 4 THEN to_date(year_plant::varchar, 'YYYY') END AS planted,
life_stage AS maturity,
'colac_otways' AS source
FROM colac_otways;

Notice that we have to convert the year (“year_plant”) into an actual date. I haven’t yet fully handled complicated fields like health, structure, height and dbh, so there’s a mish-mash of non-numeric values, different units (Adelaide records the circumference of trees rather than diameter!)

Tip for data providers #3: Follow the opencouncildata.org standards, and participate in the process.

Source code for mergetrees.sql
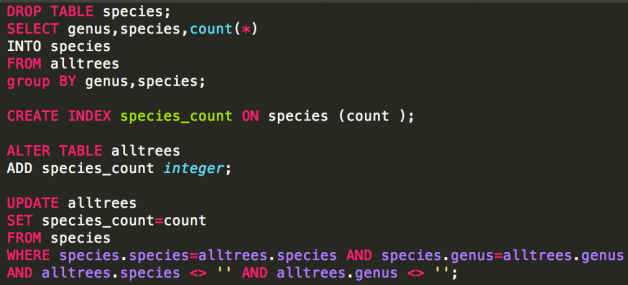
Clean the data

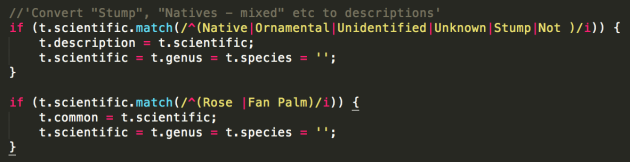
We now have 370,000 trees but it’s of very variable quality. For instance, in some datasets, values like “Stump”, “Unknown” or “Fan Palm” appear in the “scientific name” column. We need to clean them out:
UPDATE alltrees
SET scientific='', genus='', species='', description=scientific
WHERE scientific='Vacant Planting'
OR scientific ILIKE 'Native%'
OR scientific ILIKE 'Ornamental%'
OR scientific ILIKE 'Rose %'
OR scientific ILIKE 'Fan Palm%'
OR scientific ILIKE 'Unidentified%'
OR scientific ILIKE 'Unknown%'
OR scientific ILIKE 'Stump';

We also want to split scientific names into individual genus and species fields, handle varieties, sub-species and so on. Then there are the typos which, due to some quirk in tree management software, become faithfully and consistently retained across a whole dataset. This results in hundreds of Angpohoras, Qurecuses, Botlebrushes etc.Ā We also need to turn non-values (“Not assessed”, “Unknown”, “Unidentified”) into actual NULL values.
UPDATE alltrees
SET crown=NULL
WHERE crown ILIKEĀ 'Not Assessed';

Source code for cleantrees.sql

Tip for data providers #4: The cleaner your data, the more interesting things people can do with it. (But we’d rather see dirty data than nothing.)

Make a map

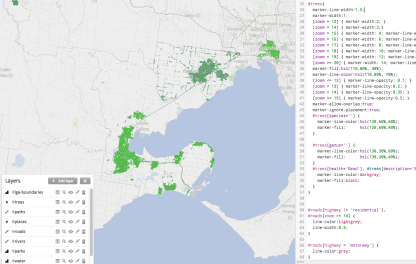
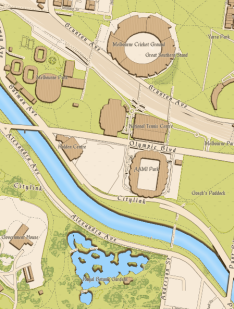
I use TileMill to make web maps. For this project it has a killer feature: the ability to pre-render a map of hundreds of thousands of points, and allow the user to interact with those points, without exploding the browser. That’s incredibly clever.Ā Having complete control of the cartography is also great, and looks much better than, say, dumping a bunch of points on a Google Map.

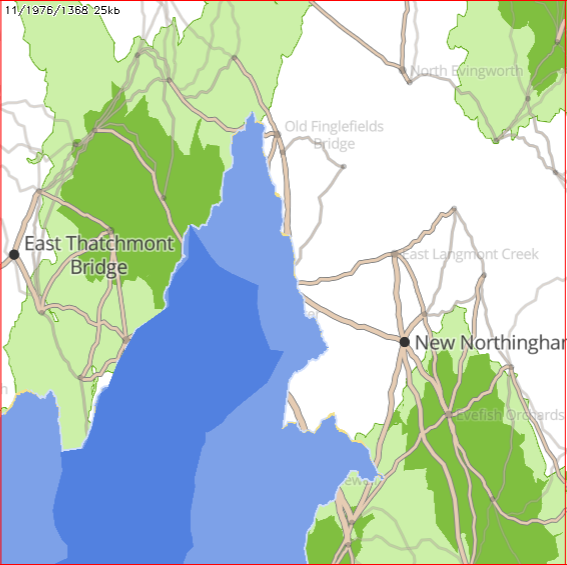
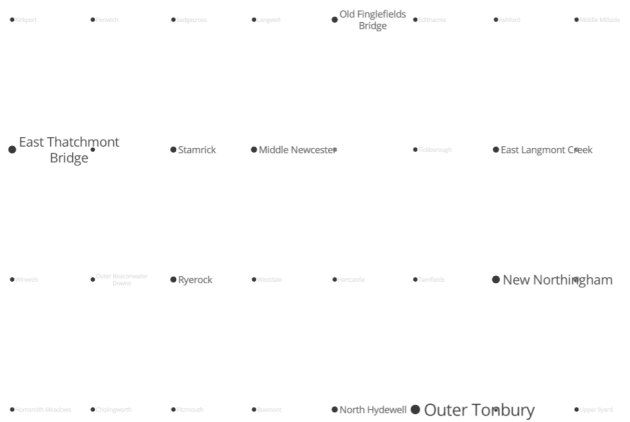
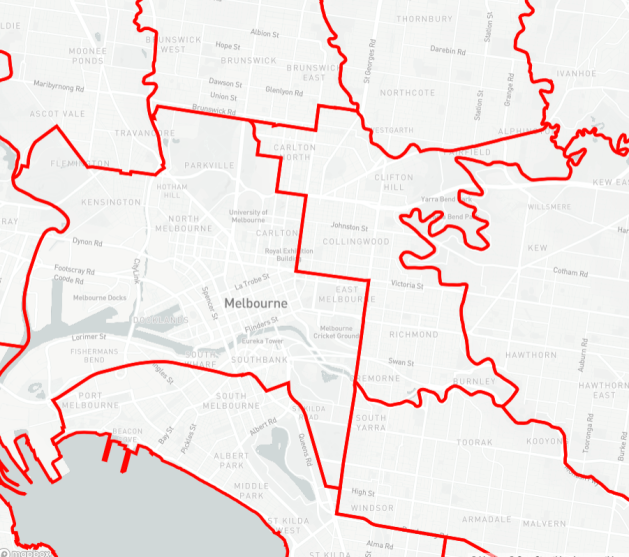
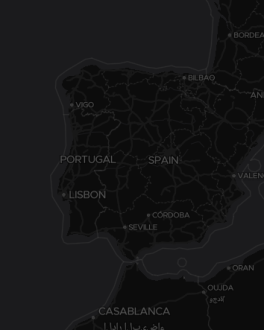
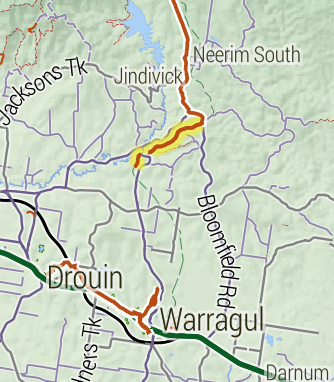
As far as TileMill maps goes, it’s very conventional. I add a PostGIS layer for the tree points, plus layers for other features such as roads, rivers and parks, pointing to an OpenStreetMap database I already had loaded. Also show the names of the local government areas with their boundaries, which fade out and disappear as you zoom in.

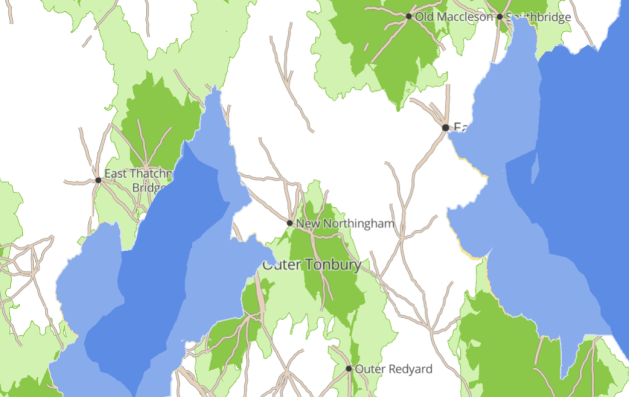
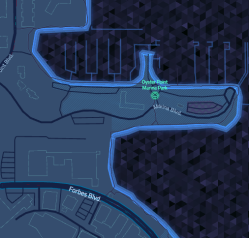
My style is intentionally all about the trees. There are some very discreet roads and footpaths to serve as landmarks, but they’re very subdued. I use colour (from green to grey) to indicate when species and/or genus information is missing. The Waite Arboretum data has polygons for (I presume) crown coverage, which I show as a semi-opaque dark green.

OpenTrees.org TileMill screenshot


Source code for the TileMill CartoCSS style.

There’s also an interactive layer, so the user can hover over a tree to see more information. It looks like this:
<b>{{{common}}} <i>{{{scientific}}}</i></b>
<br/>
<table>
{{#genus}}<tr><th>Genus </th><td>{{{genus}}}</td></tr>{{/genus}}
{{#species}}<tr><th>Species</th><td>{{{species}}}</td></tr>{{/species}}
{{#variety}}<tr><th>Variety</th><td>{{{variety}}}</td></tr>{{/variety}}

...
I also whipped up two more layers:

  1. OpenStreetMap trees, showing “natural=tree” objects in OpenStreetMap. The data is very sketchy. This kind of data is something that councils collect much better than OpenStreetMap.
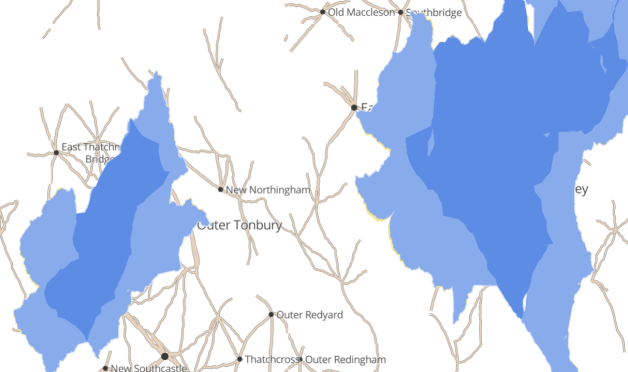
  2. Interesting trees. I compute the “interestingness” of a tree by calculating the number of other trees in the total database of the same species. A tree in a set of 5 or less is very interesting (red), 25 or less is somewhat interesting (yellow).

Source code for makespecies.sql.

Build a website

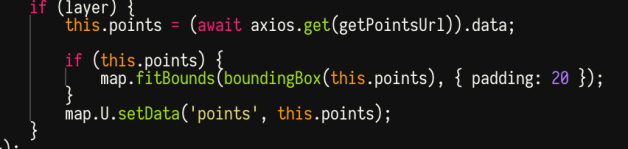
It’s very easy to display a tiled, interactive map in a browser, using Leaflet.JS and Mapbox’s extensions. It’s a lot more work to turn that into an interesting website. A couple of the main features:

  • The base CSS is Twitter Bootstrap, mostly because I don’t know any better.
  • Mapbox.js handles the interactivity, but I intercept clicks (map.gridLayer.on) to look up the species and genus on Wikipedia. It’s straightforward using JQuery but I found it fiddly due to unfamiliarity. The Wikipedia API is surprisingly rough, and doesn’t have a proper page of its own – there’s the MediaWiki API page, the Wikipedia API Sandbox, and this useful StackOverflow question which that community helpfully shut downĀ as a service to humanity.
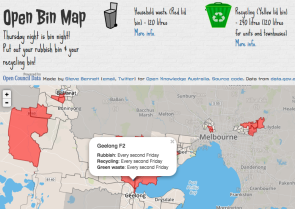
  • To make embedding the page in other sites (such as Open Council Data trees) work better, the “?embed” URL parameter hides the titlebar.
  • You can go straight to certain councils with bookmarks: opentrees.org/#adelaide
  • I found the fonts (the title font is “Lancelot“) on Adobe Edge.
  • The header background combines the forces of subtlepatterns.comĀ andĀ px64.net.

Source code for treesmap.html, treesmap.js, treesmap.css.

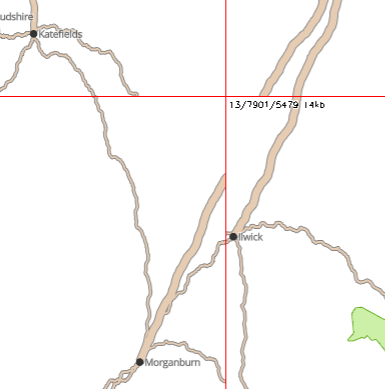
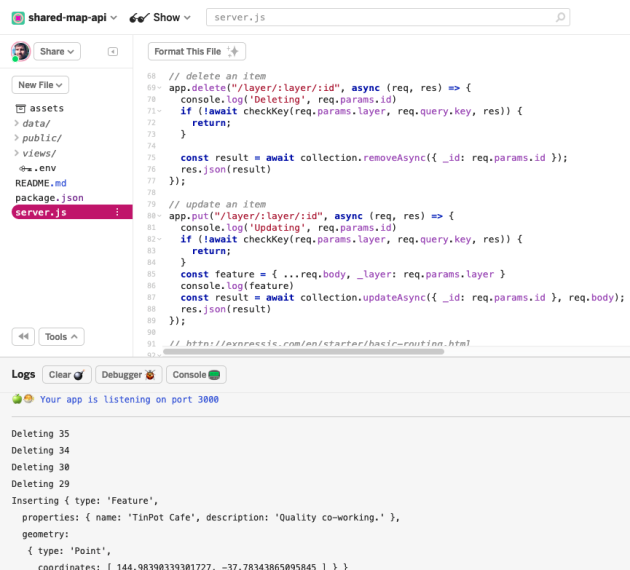
And of course there’s a server component as well. The lightweight tilelive_server, written mostly by Yuri Feldman, glues together the necessary server-side bits of MapBox’s technology. I pre-generate a large-ish chunk of map tiles, then the rest are computed on demand. This bit of nginx code makes that work (well, after tilelive_server generated 404s appropriately):
location /treetiles/ {
# Redirect to TileLive. If tile not found, redirect to TileMill.
rewrite_log on;
rewrite ^.*/(\d+)/(\d+)/(\d+.*)$ /supertrees_c8887d/$1/$2/$3 break;

proxy_intercept_errors on;
error_page 404 = @dynamictiles;
proxy_set_header Host $http_host;
proxy_pass http://127.0.0.1:5044;

proxy_cache my-cache;
}

location @dynamictiles {
rewrite_log on;
rewrite ^.*/(\d+)/(\d+)/(\d+.*)$ /tile/supertrees/$1/$2/$3 break;
proxy_pass http://guru.cycletour.org:20008;
proxy_cache my-cache;
}

Too hard basket

A really obvious feature would be to show native and introduced species in different colours. Try as I might, I could not find anyĀ database with this information. There are numerous online plant databases, but none seemed to have this information in a way I could access. If you have ideas, I’d love to hear from you.

It would also be great to make a great mobile app, so you can easily answer the question “what is this tree in front of me”, and who knows what else.

In conclusion

Dear councils,

Ā  Please release datasets such as tree inventories, garbage collection locations and times, and customer service centres, following the open standards at opencouncildata.org. We’ll do our best to make fun, interesting and useful things with them.

Love,

The open data community

Cycletour.org: a better map for Australian cycle tours

Cycletour.org is a tool for planning cycle tours in Australia, and particularly Victoria. I made it because Google Maps is virtually useless for this: poor coverage in the bush andĀ inappropriate mapĀ styling make cycle tour planning a very frustrating experience.

Let’s say we want to plan a trip from Warburton to Stratford, through the hills. This is what Google Maps with “bicycling directions” offers:

Google Maps - useless for planning cycle tours.

Google Maps – useless for planning cycle tours.

Very few roads are shown at this scale. UnlikeĀ motorists, we cyclistsĀ want toĀ travel long distances on small roads. A 500 kilometre journey on narrowĀ backstreets would be heaven on a bike, and a nightmare in a car. So you need to see all those roads when zoomed out.

Worse, small towns such as Noojee, Walhalla and Woods point are completely missing!

EnterĀ Cycletour.org:

Screenshot 2015-01-09 18.03.59

You can plan a route by clicking a start and end, then dragging the route around:

Screenshot 2015-01-13 23.43.12

It doesn’t offer safe or scenic route selection. The routing engine (OSRM) just picks the fastest route, and doesn’t take hills into account. You can download your route as a GPX file, or copy a link to a permanent URL.

Cartography

The other major features of cycletour.org’s map style are:

Screenshot 2015-01-09 18.12.04Bike paths are shown prominently. Rail trails (old train lines converted into bike paths) are given a special yellow highlighting as they tend to be tourist attractions in their own right.

Train lines (in green) are given prominence, as they provide transport to and from trips.


Screenshot 2015-01-09 18.20.23Towns are only shown if there is at least one food-related amenity within a certain distance. This is by far the most important information about a town. Places that are simply “localities” with no amenities are relegated to a microscopic label.


Screenshot 2015-01-09 18.27.40Major roads are dark gray, progressing to lighter colours for minor roads. Unsealed roads are dashed. Off-road tracks are dashed red lines. Tracks that are tagged “four-wheel drive only” have a subtle cross-hashing.

And of course amenities Screenshot 2015-01-09 18.57.40useful to cyclists are shown: supermarkets, campgrounds, mountain huts, bike shops, breweries, wineries, bakeries, pubs etc etc. Yes, well-supplied towns look messy, but as a user, I still prefer having more information in front of me.

Terrain

Screenshot 2015-01-09 19.11.23
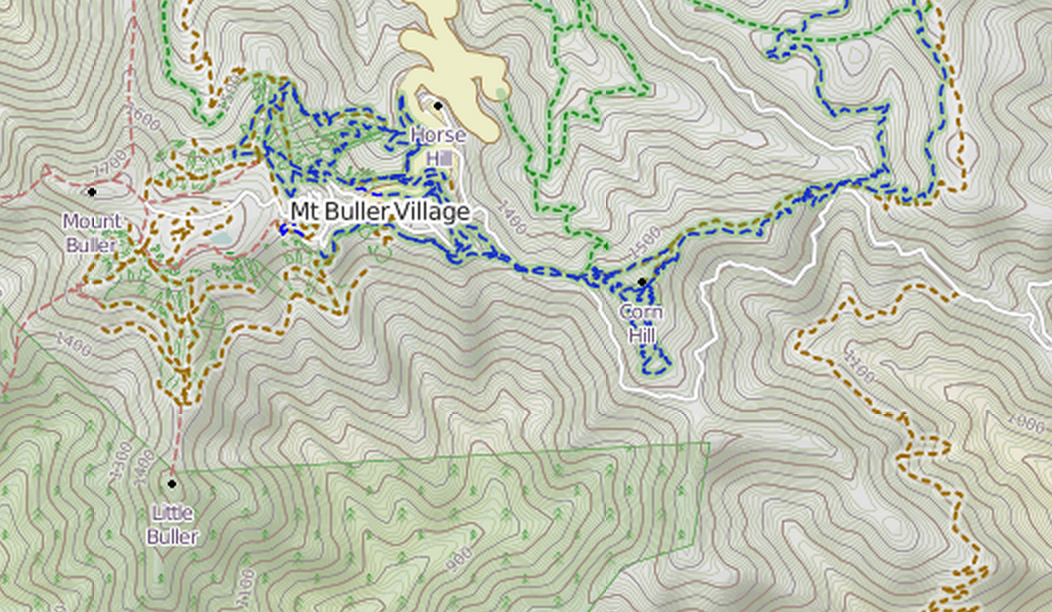
The terrain data is a 20 metre-resolution digital elevation model from DEPI, within Victoria, trickily combined with a 90m DEM elsewhere, sourced from SRTM (NASA). I use TileMill‘s elevation shading feature, scaled so that sea level is a browny-green, and the highest Australian mountains (around 2200m) are white, with green between. 20-metre contours are shown, labelled at 100m intervals.

I’m really happy with how it looks. Many other comparable maps have either excessively dark hill shading, or heavy contours – or both.

Screenshot 2015-01-09 19.21.02

4UMaps

Screenshot 2015-01-09 19.20.35

Komoot

Screenshot 2015-01-09 19.20.24

OpenCycleMap

Screenshot 2015-01-09 19.20.15

Sigma

Mapbox Outdoors

Google Maps (terrain mode)

Screenshot 2015-01-09 19.35.37

MapBox Outdoors


Other basemaps

Screenshot 2015-01-09 19.39.25

VicMap

I’ve included an assortment of common basemaps, including most of the above. But the most useful is perhaps VicMap, because it represents a completely different data source: the government’s official maps.

Layers

Vegetation

Vegetation

There are also optional overlays. Find a good spot to stealth camp with the vegetation layer.

Or avoid busy roads with the truck volume layer. This data comes from VicRoads.Screenshot 2015-01-09 19.47.43

The bike shops layer makes contingency planning a bit easier, by making bike shops visible even when zoomed way out. The data is OpenStreetMap, so if you know of a bike shop that’s missing (or one that has since closed down), please update it so everyone can benefit.

Screenshot 2015-01-14 00.06.20

Mobile

Unfortunately, the site is pretty broken on mobile. But you can download the tiles for offline use on your Android phone using the freemium appĀ Maverick. It works really well.

Other countries

Screenshot 2015-01-14 00.46.05

is.cycletour.org for Iceland. Yes, it’s real – but I don’t know how long I will maintain it.

It’s a pretty major technical undertaking to run a map for the whole world. I’ve automated the process for setting up cycletour.org as much as possible, and created my own version for Iceland and England when I travelled there in mid 2014. If you’re interested in running your own, get in touch and I’ll try to help out.


Feedback?

I’d love to hear from anyone that uses cycletour.org to plan a trip. Ideas? Thoughts? Bugs? Suggestions? Send ’em to stevage@gmail.com, or on Twitter at @Stevage1.